

Ewing Morris Select Credit Fund LP
A New Approach to Invest in Our Best
For discussion purposes only and not intended for public use or distribution. Information provided is for informational purposes only and should not be construed as personal investment advice. There can be no guarantee that any projection, forecast or opinion will be realized and users of these materials are advised to conduct their own analysis prior to making any investment decision. Past performance does not guarantee future results.
Contents
The history of our work and the opportunity at hand (two minutes)
Strategy returns and risk profile (three minutes)
Our approach to capitalizing on "Outlier Ideas" (five minutes)
Case studies of all Outlier Ideas (fifteen minutes)
Portfolio Manager // Data // Legal
Background
In March of 2020, a client-driven interaction drove a new investment objective: equity-like returns generated by an exceptionally focused, high conviction, credit-centric portfolio. The strategy would be opportunistic in its nature, having flexibility across asset classes, capitalizing on our credit- and engagement-based insight. We embraced this idea and have been executing this strategy since it was funded April 29, 2020.
After more than five years of operation, the strategy's execution and results have laid bare what we've known all along - that truly great investment opportunities are rare. And when these opportunities are found, the patience that afforded their discovery should be matched with an urgency to act.
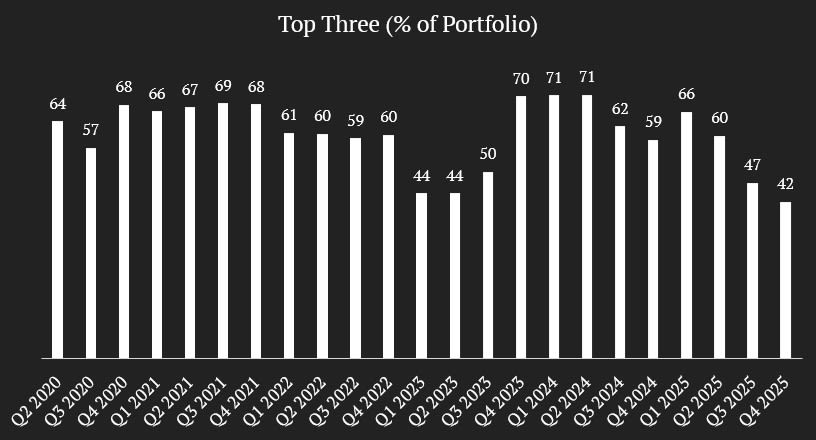
Since 2020, this patience, urgency and conviction has resulted in an exceptionally focused portfolio, where the strategy's top three ideas have comprised the majority of the portfolio.

After distilling years of decision-making and investment performance, we are sharing with you what we have learned from this investment experience and how we can further capitalize on these insights together.
Performance
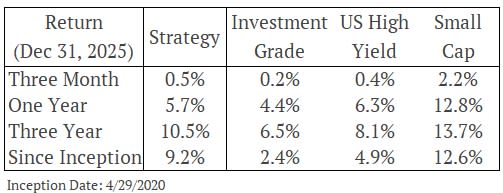
Over the five years the strategy has been managed, we have seen a variety of environments. Across these varied environments, the Strategy has returned 9.2% since inception (net of all fees), despite a higher-quality credit focus.

Source: Ewing Morris, Bloomberg
Source: Ewing Morris, Bloomberg
Performance is based on returns for the Ewing Morris Select Credit Fund LP. Inception date of the strategy is April 29, 2020. As of May 1, 2025 returns are based on Class P, net of fees and expenses. Class P units bear management fees of 0.75% per annum, as well as performance fees, as applicable. From February 1, 2025 to April 30, 2025, returns presented were those of Class S of the Fund, which bear management fees of 0.5% per annum, as well as performance fees, as applicable. Between April 29, 2020 to January 31, 2025 returns are based on a separately managed account, which shared a similar investment objective and strategy as the Ewing Morris Select Credit Fund LP and were calculated net of fees and expenses matching that of Class P. While the Fund’s overall investment objective remains the same, its past performance is not indicative of future performance, and the inclusion of management fees. Where the performance period is longer than 12 months, returns are annualized. 2020 represents the return since inception of the Fund to December 31, 2020. The High Yield Benchmark is represented by the iShares U.S. High Yield Bond Index ETF (CAD-Hedged). The Investment Grade Benchmark is represented by the iShares Canadian Corporate Bond Index ETF. Small Cap is the Russell 2000 Total Return Index. Strategy returns are based on an initial separately managed account, which shared a similar investment objective and strategy to the Select Credit Fund.
Due to the flexibility and focus of the strategy, double digit returns have been achieved even though we've made the deliberate choice to focus on a much lower-risk asset class: performing corporate debt (hence the modest yield). The bonds we buy typically have less volatility than equities and bear a credit quality in the BB and B range. These rating categories have default rates that have averaged 0.79% and 3.89% since 1981 (Source: S&P Global Inc).
With these results at hand, it is clear that a portfolio's yield does not equal its return. In fact, the average portfolio yield since inception has averaged under 5%. Under our management style, the portfolio's yield is far more descriptive of its risk profile (B-BB) than its expected return.
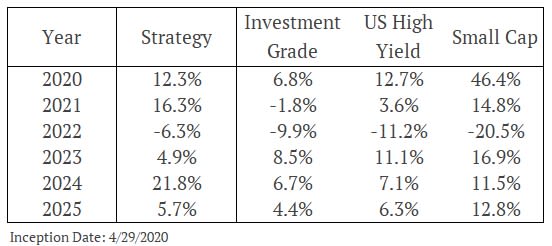
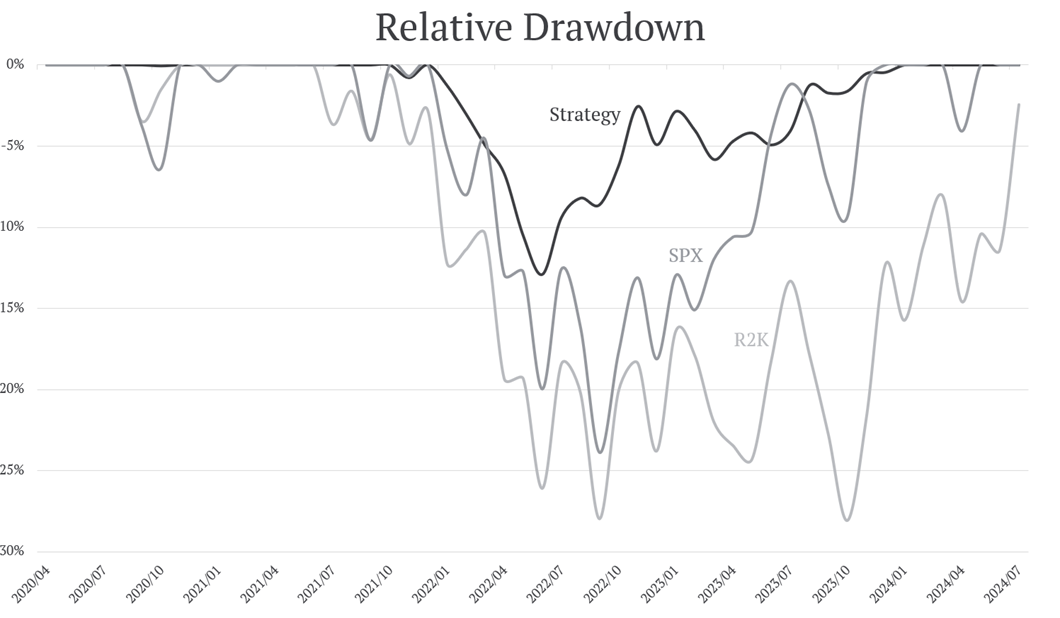
The risk profile becomes evident when looking at calendar returns, drawdown and volatility.

Source: Ewing Morris, Bloomberg. Performance to 12/31/2025.
Source: Ewing Morris, Bloomberg. Performance to 12/31/2025.

Source: Bloomberg
Source: Bloomberg
The strategy has produced returns that are nearly double the high yield benchmark, with less volatility. It has also topped all three asset class benchmarks from a risk-adjusted return perspective (as measured by return divided by volatility).

Source: Ewing Morris, Bloomberg. Performance to 12/31/2025.
Source: Ewing Morris, Bloomberg. Performance to 12/31/2025.
With the benefits of portfolio focus in clear view, we looked at our decision making in deeper detail.
We were curious to see if the benefits of concentration extended across our decision making within the portfolio.
Since inception through 2024, we have made seven investments which have exceeded 20% in weight. We call these "Outlier Ideas". We examined the results of this pool of investments to see if their aggregate returns were meaningfully higher or lower than the returns of the broader strategy. The data confirmed the theme.
Our Outlier Ideas, when combined as one pool of investments (cash flows), produced excellent results:
A 23.5% holding period return and an 18.6% IRR.
Strategy
Core Features:
Public Market Securities
High Conviction Ideas
Equity Return Hurdles
Debt Risk Profile
A Distinct Approach
This strategy largely takes the opposite approach to what is conventional. This means that we favor investing time in investment research and open exploration instead of interfacing with the market. We favor working a size order on a great idea than trading around bonds every day for nickels and dimes. We favor spending time in the secondary market, finding the wildly mispriced securities that have left everyone's radar than spending time looking at bonds that have the greatest audiences - the bonds being sold to the whole market by banking professionals. And we favor exploring the whole breadth of what the market has to offer instead of constraining ourselves to a neat little box, even if that comes at the cost of being less well-understood. It's also a long-term professional strategy designed to compound both personal drive, energy and fund value over time.
A Word on Tax
In fixed income in particular, two investments with the same pre-tax return can produce a much different after tax result. The difference is driven by how much capital gains are contributing to the investment's return versus ordinary income. A private debt investment issued at par, such as a loan to a private company or a mortgage bears a meaningfully higher tax burden than that of a low-coupon bond purchased at a large price discount. As our investors are family offices and high net worth individuals, our focus on tax at the individual security level has always been top of mind. This has shone through in results. For example, our greatest single contributor to returns has been a convertible bond we purchased in the low 60's. Its coupon: 0.5%. And, we have yet to realize the capital gain.
Blending Structures to Win
Closed and open-end funds each have attractive attributes. We have designed an evergreen structure that blends the right aspects of both. The Fund is fully funded, with an unencumbered ability to be opportunistic, with no time or profit lost due to the logistics of calling in capital. The Fund offers superior Limited Partner liquidity compared to closed-end term structures via a rolling twelve-month redemption notice period. And, because of its transparent underlying public market investments, the Fund has the benefit of monthly performance measurement and liquidity. The Fund is simply designed for investors who share a long-term mindset and who want to gain access to opportunistic, high-conviction investments in public markets.
Terms
Indicative terms, for discussion purposes only and subject to change.
Similar to our Flexible Fixed Income Fund LP, we are offering seed terms on the first $25 million of capital.
Class S (seed - min $5mm) management fees will initially be 0.5% and decline to zero in 10bps increments for every $10 million in Fund assets above $25 million. This means when the Fund net asset value exceeds $75 million, seed class investors will be paying no management fee. The Class A management fee will be 0.75%.
Both the Seed Class and Class A investors will have a Performance Fee of 20%, provided a 7% minimum net return hurdle has been met, with standard high water marks.
Legal: BLG - Prime: BMO - Fund Admin: SSSG - Auditor: PWC
Work
Below is an account of all investments made since inception that exceeded 20% in weight - our "Outlier Ideas"
The Outlier Ideas


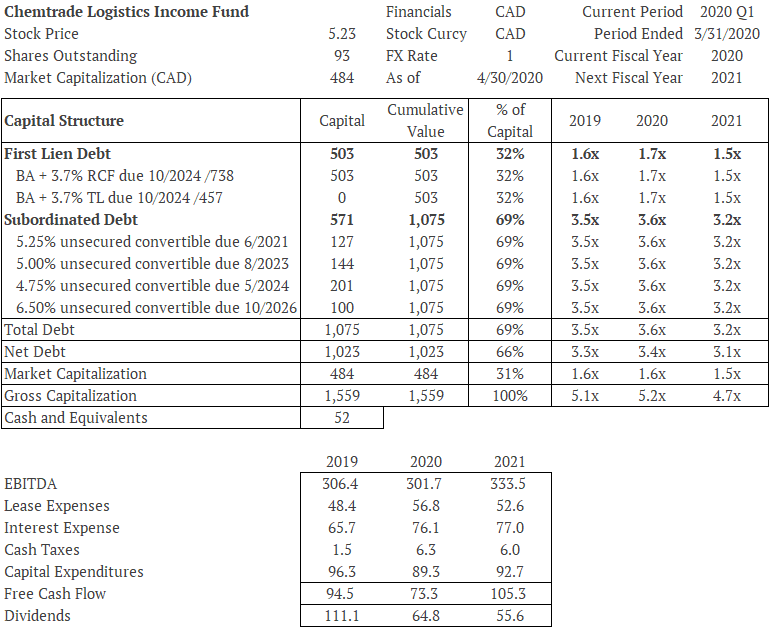
Chemtrade Logistics Income Fund
In March 2020, many bonds traded at inconceivable prices. But in April 2020, while most of the market was shooting higher, Chemtrade convertible debentures continued to trade at absurd levels thanks to a little-known Canadian ETF.
Chemtrade is a North American industrial chemical manufacturer and distributor. We were familiar with Chemtrade as it was the buyer of Canexus - a credit we cheerfully owned into that acquisition. We were comfortable with the backdrop in the covid context, as refineries still needed to operate at reasonable utilization rates, underpinning the company's regen acid business. Water treatment customers were also not changing their demand. Chemtrade also had non-core assets it could sell as well as a fulsome dividend it could cut.
In mid-April, we identified an obscure, Canadian convertible-focused ETF that was set to offload Chemtrade's 2023 and 2024 debentures as they were trading below the underlying index's 80 cent inclusion threshold. The deletion auction was at April month-end. We paid an average of 72.09 and 66.43, respectively, for Chemtrade's 5% 2023 and 4.25% 2024 debentures, with a weight exceeding 20% between these two securities. After the company cut its dividend in half and exited a non-core asset, we exited the investment around par, realizing a 49% and 60% holding period return (respectively) and an IRR exceeding 30% on both investments.
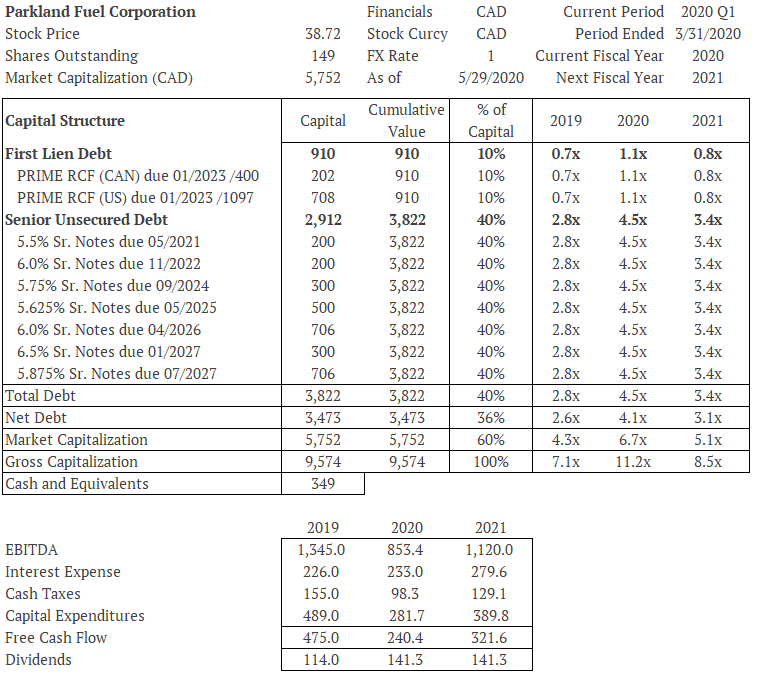
Parkland Corporation
With energy markets in disarray in the spring of 2020, Parkland's bonds got painted with an energy discount, even though it produced no oil and gas. It merely distributed refined product - mainly gasoline. As a result of the energy stigma, the bonds traded wide relative to peer bonds of similar risk.
In addition to being a long-time bondholder of the company, our equity team was also invested in Parkland, which brought the skills of our entire organization to bear on the file. As reduced driving dented gasoline demand, we had confidence in Parkland's management team to handle the turbulence and saw no need for the company to have to turn to the capital markets to bridge themselves through the pandemic.
We paid 99.625 for our principal position, the 5.625% bonds due in 2025. When combined with our purchase of the 2028 bonds, our weight exceeded 20%. After management accelerated its deleveraging goals to work toward an investment grade credit rating and the operations showed the resilience our team expected, we exited the bonds less than a year later to fund more attractive opportunities. We realized an IRR of 10.5% and 15.5% on the 2025 and 2028 bonds, respectively. A fine result for a conservatively managed, high quality BB issuer.
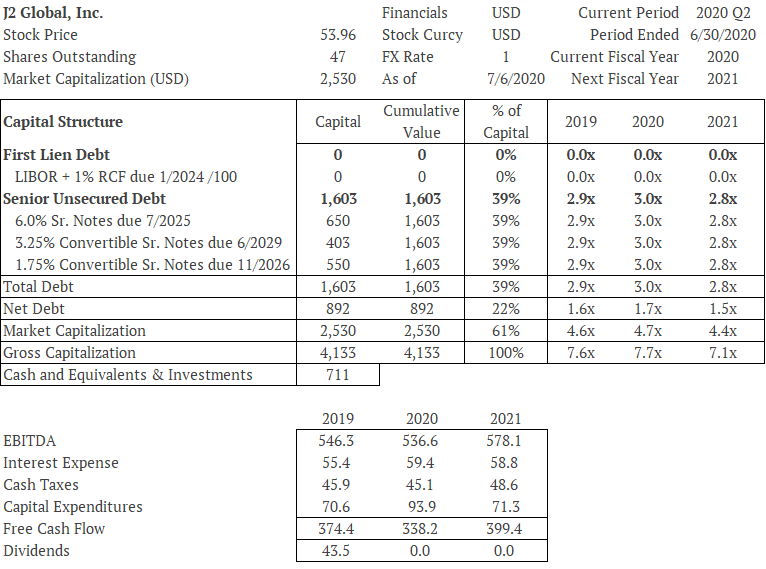
J2 Global
In the summer of 2020, Hindenburg Research published a short sale report on J2 Global. Over the subsequent month, the stock fell 22%, below its March 2020-low. We were very familiar with the company as we had owned J2 bonds in the past and we owned a large weight in the stock in our equity funds since 2015. As our entire team had a focus on the file, the dislocation caused by Hindenburg was a perfect opportunity to consider its convertible bonds which fell in sympathy.
From a fundamental perspective, although the short seller's criticisms regarding corporate governance were reasonable, the fundamentals of the business were strong. Its programmatic acquisition strategy had been well-executed over time, it continued to generate abundant free cash flow and the company was sitting on substantial cash and investments that essentially de-risked the balance sheet.
We purchased an 18.5% position in J2 Global's 1.75% senior convertible notes due in 2026 at $86.8 on largely a constructive credit view. We purchased a 3.0% weight in the company's 3.25% senior convertible notes due 2029 at 102.75, with a view that the security bore no actual downside since it was putable in one year, yet had upside through a 15% FCF yield (2019) in the equity and a strike price only 20% from the market price at the time of purchase. We exited the 1.75% notes with a 17.8% holding period return. As our view on the business and equity played out, evaporating the short seller cloud, we exited the 3.25% bonds with a 90.9% holding period return.
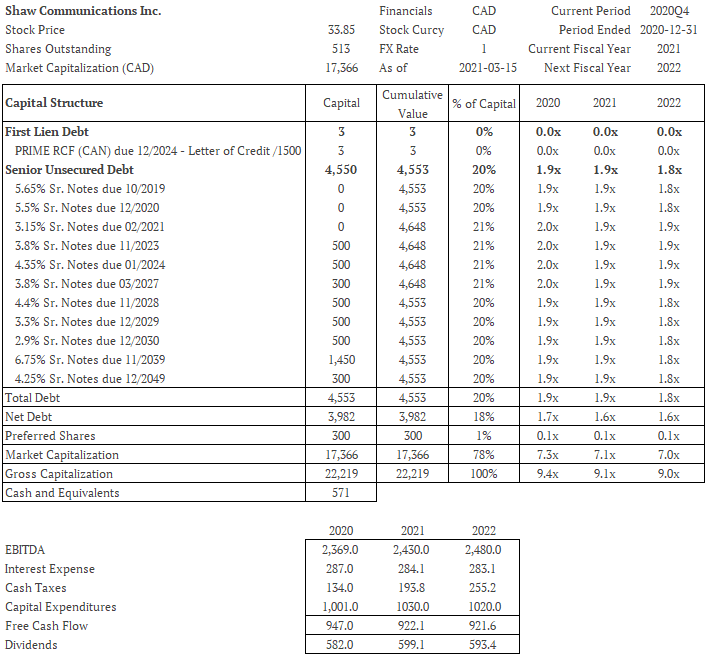
Shaw Communications
Some opportunities last for days. Some last for hours. Some last as long as a phone call. On March 15, 2021, a landmark deal was inked where Rogers was buying Shaw Communications in an all-cash transaction. That morning, we received a phone call. The call where you know why you're the one who's getting the call; you understand why the seller is selling; and, you've done the work to be in a position to transact.
In March of 2021, despite the recovery in risk markets, interest rates were virtually zero and Shaw's reset preferred shares were deeply underwater, trading at $16 per share. To our surprise and excitement, the announcement took the Shaw B preferreds up far less than we were expecting. As we bought a size position in a similar situation in the past (Rona preferreds when Lowe's was buying Rona), we received a call the morning the deal was announced. That call offered a block for sale, from entities (likely retail or regulated institutions) that were simply not accustomed to pricing event-driven situations and were happy to take the liquidity.
We bought a 13% position in the Series B preferred shares in one trade mid-morning and followed with another 8% in the Series A preferred shares the next day. The timing of the deal was very fortunate, as Shaw preferreds had a reset/redemption date of June 30 - only a few months away. Clues regarding a possible redemption were aplenty to those paying close attention. The press release, merger agreement, media reports and Rogers' own capital structure all hinted at a harmonized pro-forma capital structure (ie: one without preferreds) . The preferreds were redeemed by the company at $25 June 30th, 2021. In less than four months, we captured a holding period return on the series B and A preferreds of 35% and 21%, respectively (IRR: 184% and 95%). And this outcome was achieved all independent of the closing risk of the broader corporate transaction.
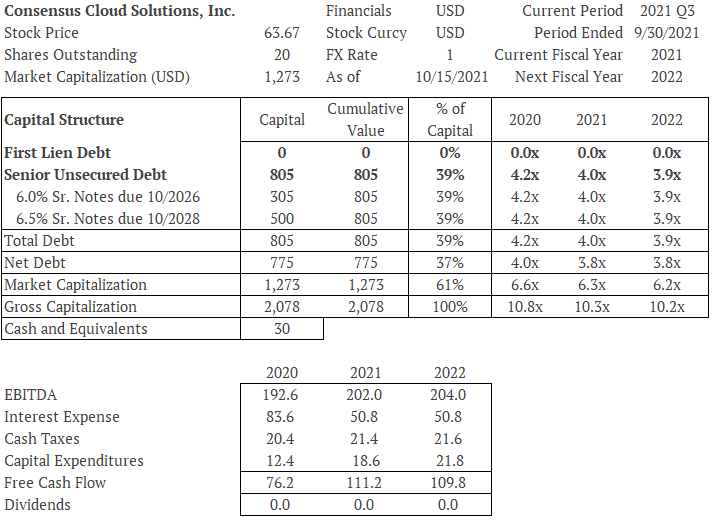
Consensus Cloud Solutions
As a spin-out of J2 Global's e-fax communications business, and led by J2's former CFO Scott Turicchi, we were inclined to invest in the company's bonds. Scott's conservative management of J2's capital structure gave us confidence in his plans at Consensus; leverage 4x at the time of the spin, with plans to delever to 3x via earnings growth and strong free cash flow. The stock debuted at a 9x EBITDA multiple. Beyond the solid credit picture, we thought that as Consensus was a first-time issuer, we could capture a discounted new issue price in what was otherwise an expensive high yield market. Our suspicions were proved correct and the bonds traded up 2-3 points soon after their issue. Our position between the 6% and 6.5% notes due 2026 and 2028 totaled ~25%. Due to our long-time relationship with company leadership, we received 100% of our new issue order.
But then interest rates went up. A lot. Consensus failed to deliver on the growth objectives it outlined to the street. And, its core business softened somewhat more than expected. Over the period we held our bonds, the stock fell 40%. Despite all these headwinds in rates, the business and the stock, Scott kept paying down debt, as promised. This, combined with an excellent purchase price, time and opportunistic exits in the market and directly with the company, our holding period return was more than 15% on both issues and well in excess of the market's (iShares US High Yield ETF), holding period return of 4.2%.
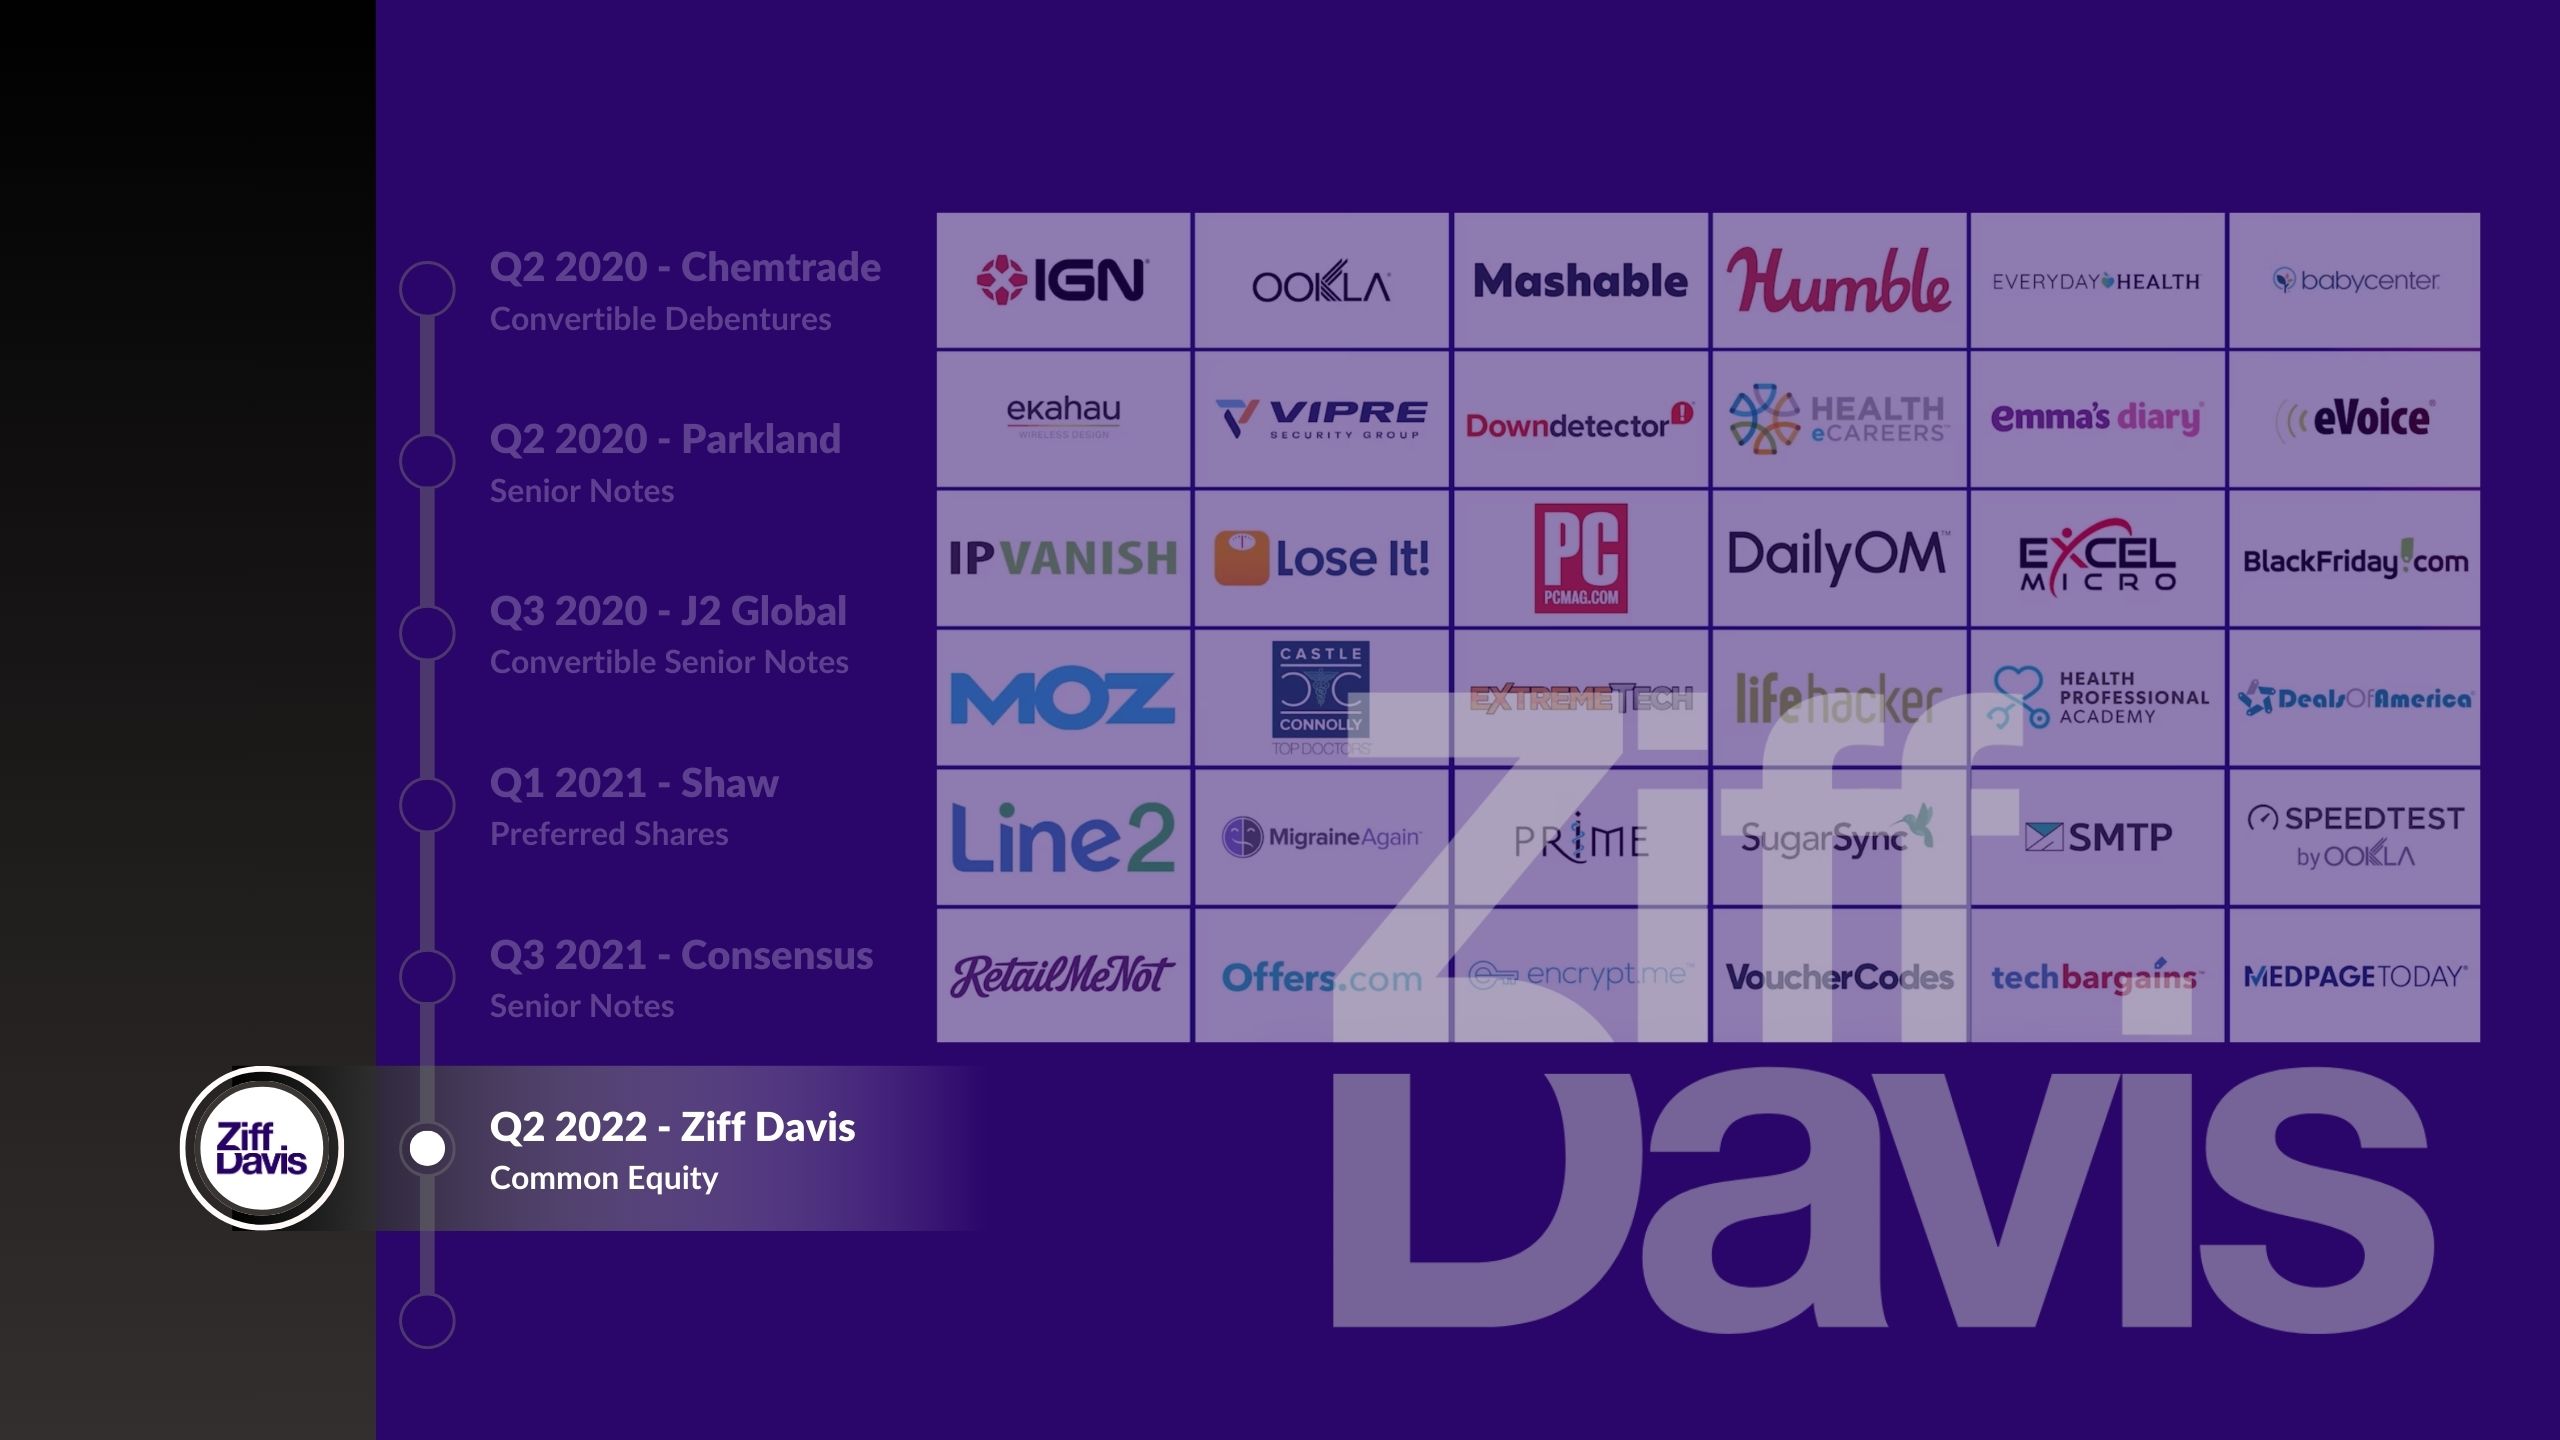
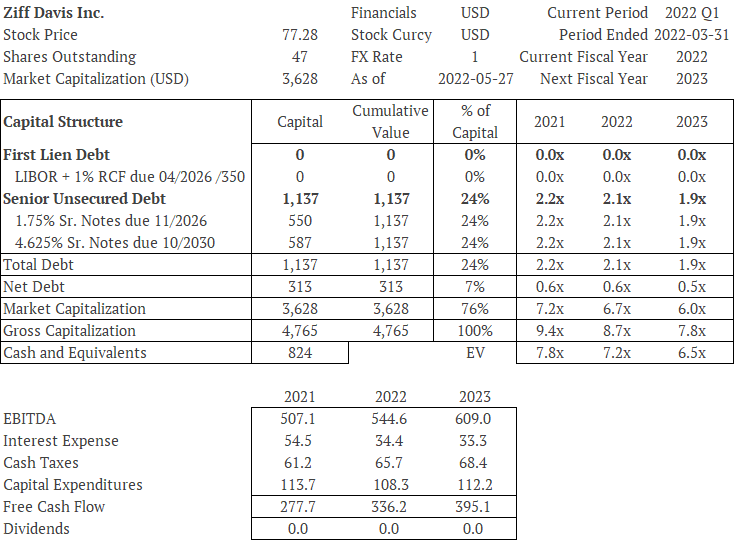
Ziff Davis
Ziff Davis was the remainco of the J2 Global spinout transaction. After the spin, Ziff Davis continued executing its acquisition strategy. Its lifetime EBITDA multiple paid on acquisitions is a remarkable 5x. In mid 2022, Ziff was trading at 6x EBITDA and had a 10% free cash flow yield to the enterprise.
Ziff was an ideal platform for a take-private and the company's capital allocation skill could also generate value through open market stock buybacks if acquisitions were difficult to find at the right price. With growth in long-term earnings power, historical acquisition deployment and a lift in multiple toward that of 'high performance conglomerates' we saw a double in the equity very acheivable. We bought a 21.5% weight in the common equity.
But then large language models (ie: ChatGPT) were released. About half of Ziff Davis' business is driven by advertising on their digital properties. This mattered because instead of a user finding a product comparison review on a Ziff Davis website, users could now ask ChatGPT itself to review or compare any products they wanted, on-demand. Perceived or real, it was a threat to the business and the equity valuation. There existed reasonable, nuanced counter-arguments at the time: traffic appeared unimpacted thus far, LLM owners will partner with Ziff to access content to train their models and half of Ziff's revenue is subscription-based and relatively insulated from this risk. We believed none of these arguments were strong enough to matter.
After many years of top-five exposure to Ziff Davis in one form or another across our entire firm, we exited our position in the strategy in early 2023 at an average of $82.01, a 3% loss.
As of October 2024, the stock is below $44.
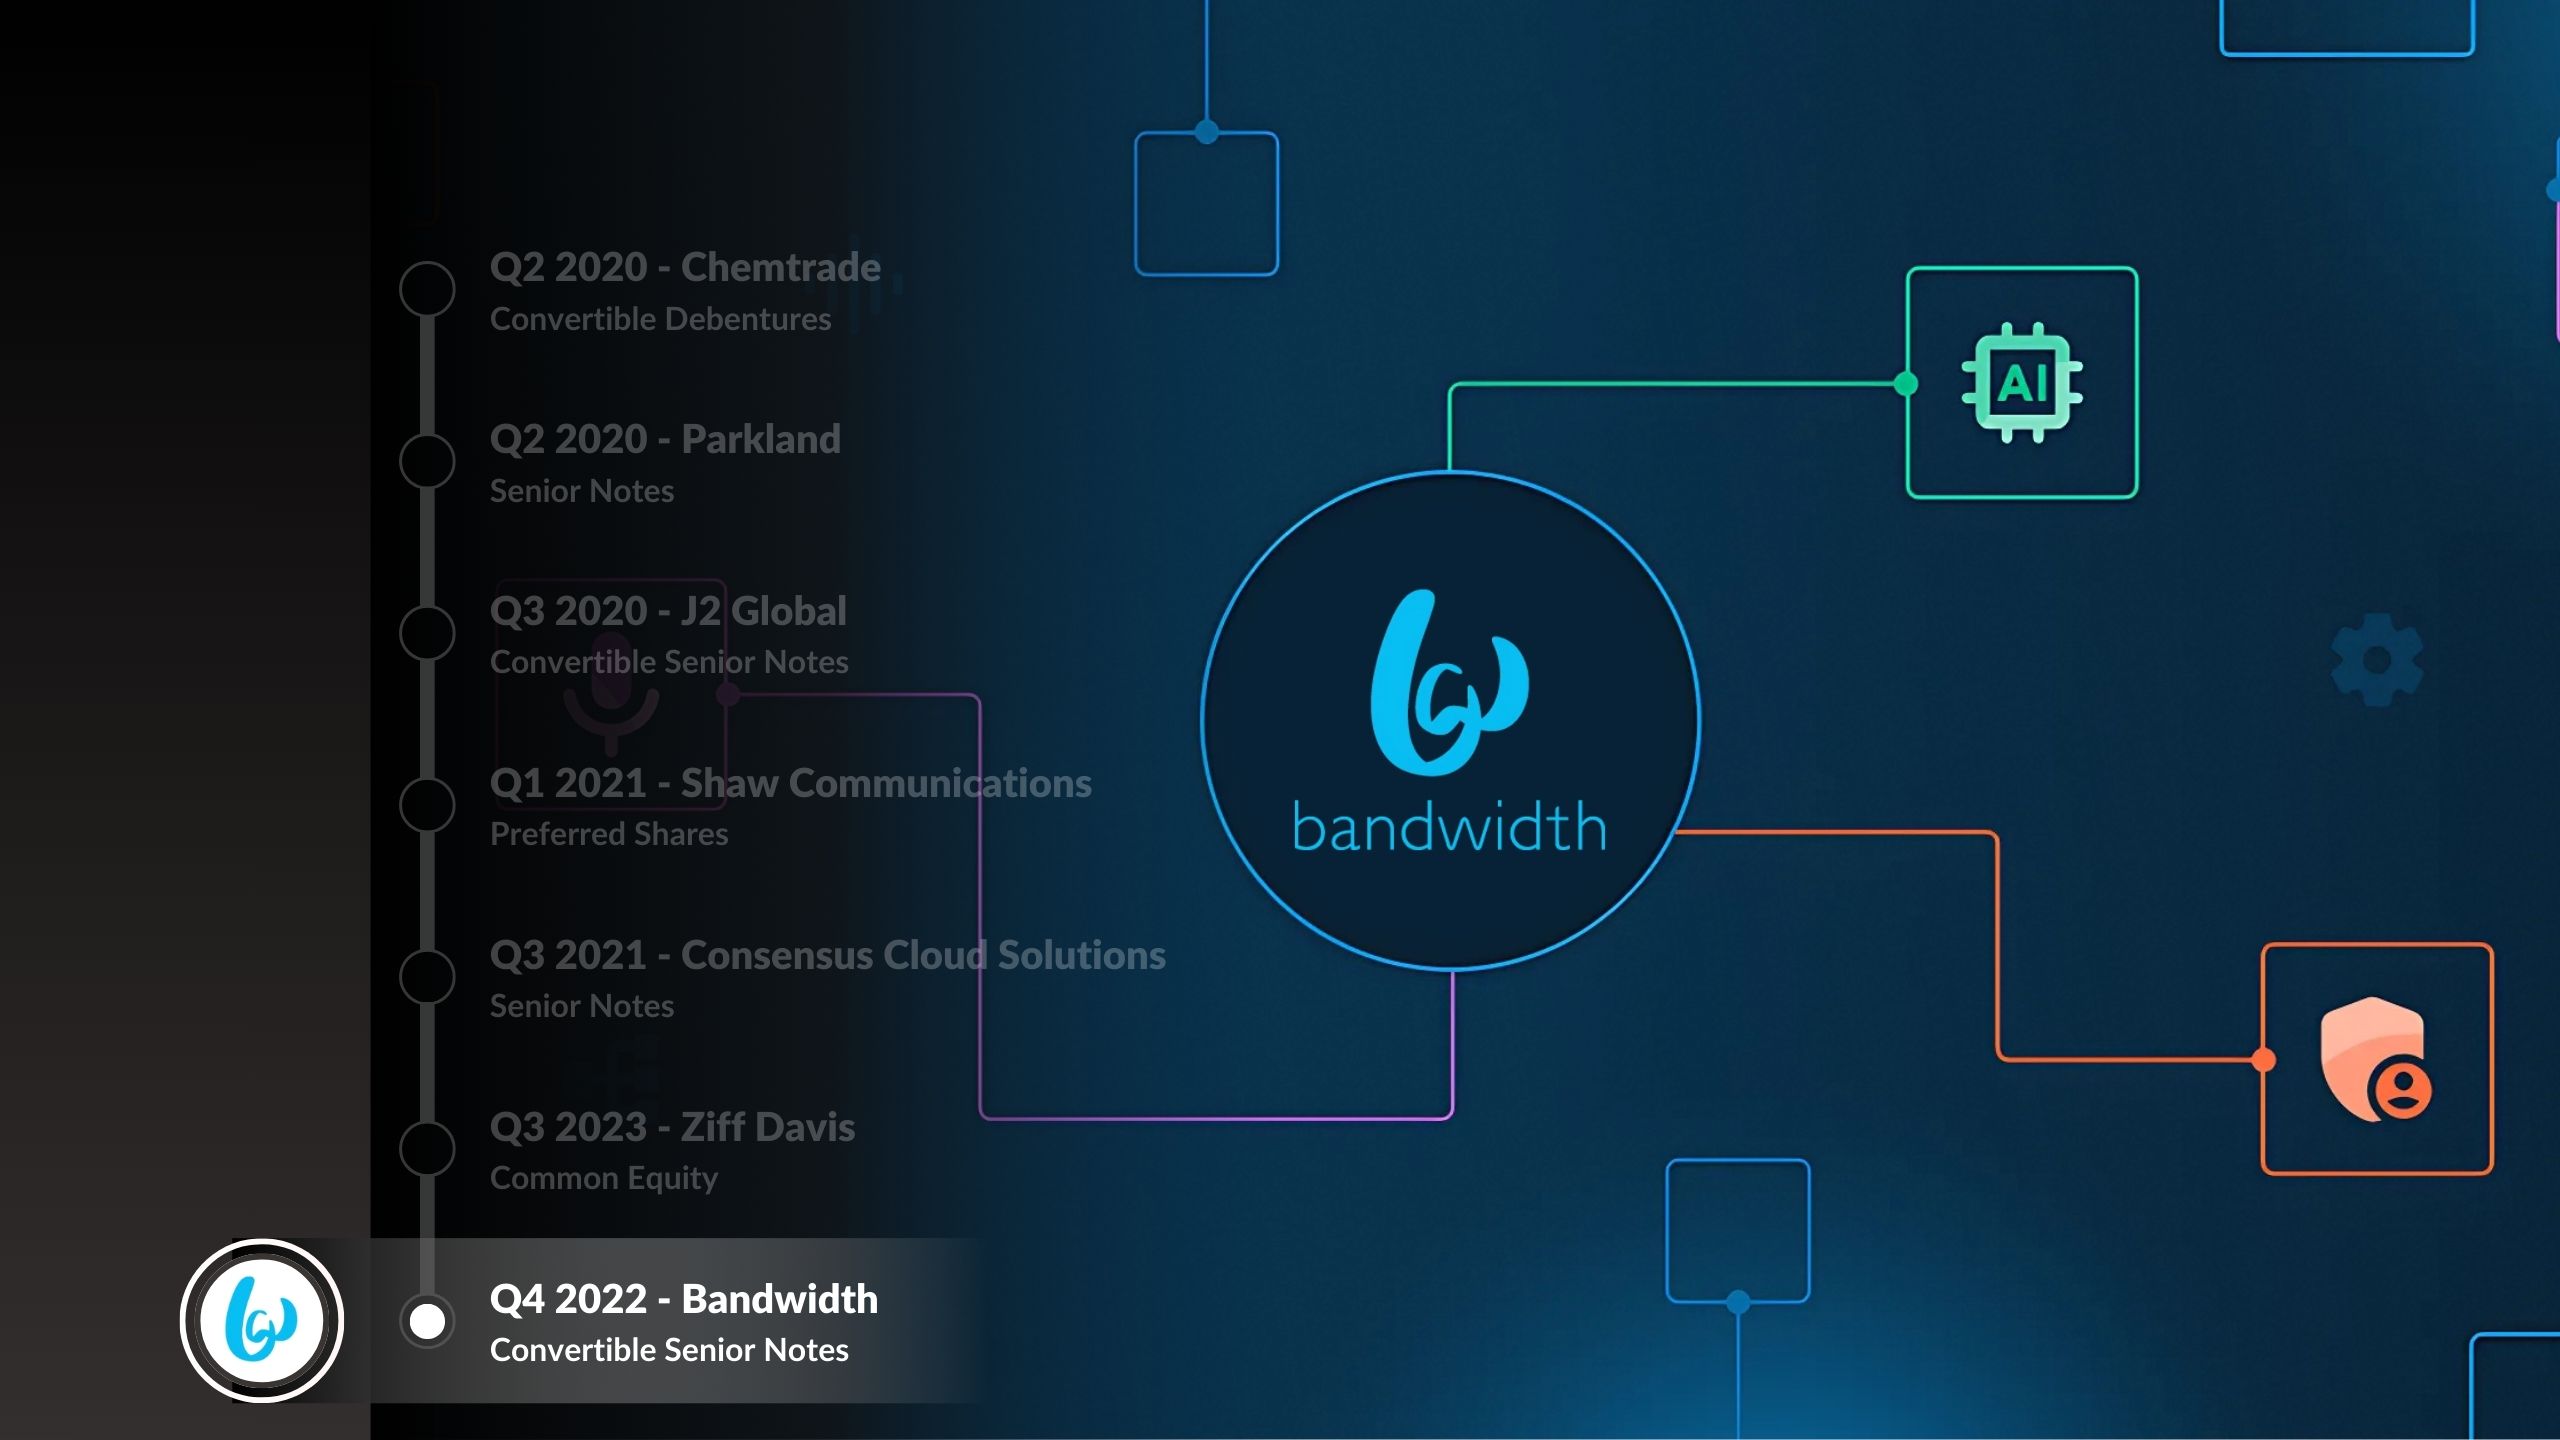
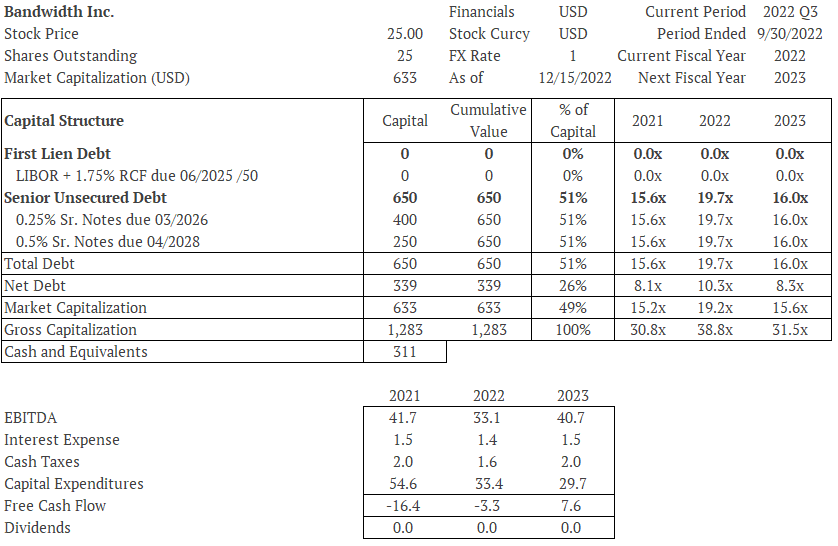
Bandwidth
Bandwidth is in the business of telecommunications and software. It has a software-powered network that its customers use to send things like appointment reminders by text and the ability for people to dial into a teams or zoom meeting, for example. Following a debt-financed acquisition at 6x revenue in 2020, the rapid increase in interest rates and a slowdown in growth, we found Bandwidth's trading in the low 60's. At the time, the equity market capitalization was worth nearly half of the business value, clearly pointing to a mispricing in the debt.
We saw the business as having reasonable fundamentals. Expert network opinions cited Bandwidth having the best infrastructure in the industry and the company was consistently profitable prior to its IPO at a much smaller scale. The company clearly had untapped earnings power - this is why the equity carried the value it did. The bond market on the other hand was uncomfortable with its founder and CEO, David Morken. Our differentiated view was that the market was missing immense, unpriced takeout optionality in the bonds - that a sale could lead to a par exit price versus a low 60's current market price. There was evidence of contemplation of a sale in several places, including David's very own employment contract. Absent an event, the bonds also underappreciated two other factors: 1) the potential for Bandwidth's cash flow to rapidly improve in 2023 and 2) David was already making great strides in de-risking the balance sheet, with a 160 million-dollar buyback of its 2026 convertibles.
Over the ensuing year, we built a 36% position in the 2028 senior convertible notes at an average cost of $62.34. Since our original purchase, the company has performed well; it has rapidly paid down debt; and now the 2028 bonds are the principal remaining piece of debt outstanding. As of December 31, 2024, the 2028's trade above $80, representing a holding period return of 29% and IRR of ~20.2%.
A Notable Mention:
Shareholder Engagement
Over the last two years, we have increasingly focused on situations with a particular feature: energized shareholders.
In our experience, companies with shareholders who have grown impatient and energized are more likely candidates for corporate transactions. Corporate transactions are quite often positive for bondholders as bonds usually have to be retired on the closing of a deal. For a bond trading at a discount to its principal value, this kind of event can pull years of return forward. Since pessimistic credit investors tend to pay nothing for what isn't a matter of fact, we believe there exists free option value in certain underlying bonds in the market. However, identifying these situations requires shareholder engagement experience, something that bondholders rarely have.
Here are two examples of situations we capitalized on that follow this theme:
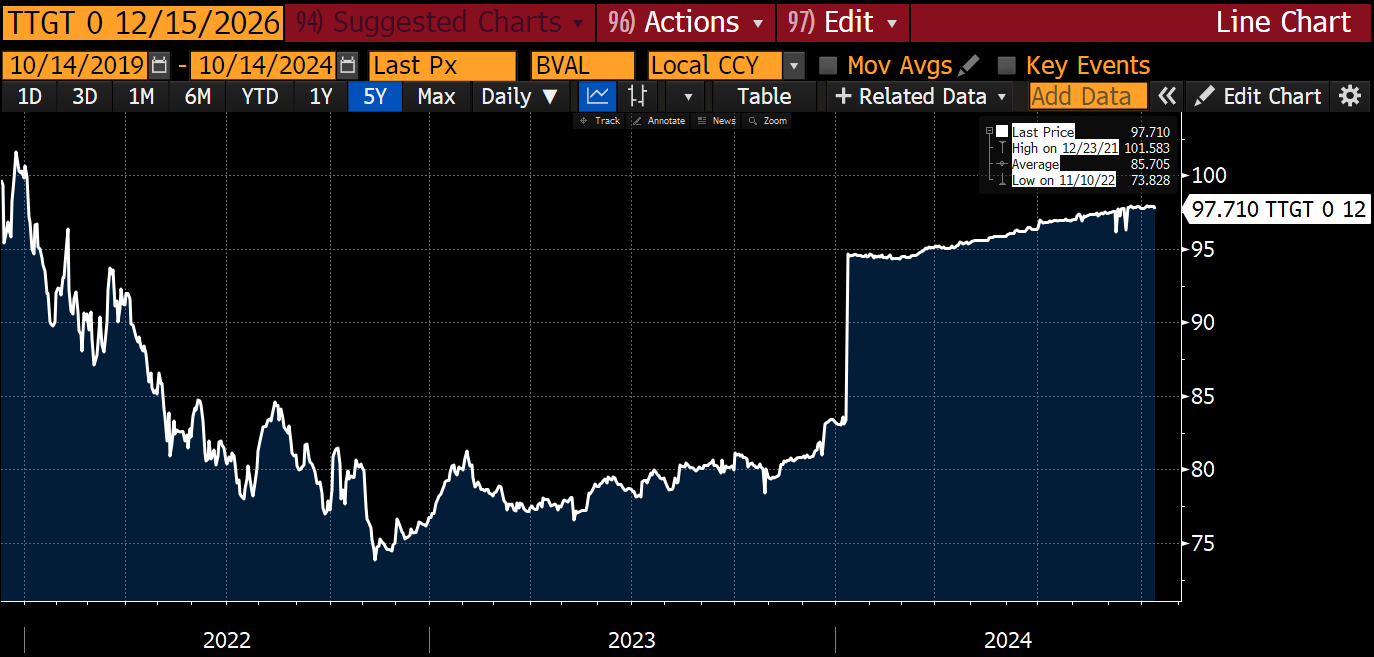
Techtarget
We made our investment in Techtarget’s convertible bonds due in 2026 at a price averaging under 80 cents on the dollar in early 2023. Techtarget is a digital media publisher. The day we bought the bonds, shareholders were upset. The stock was down 15% on the day on account of the company reporting disappointing earnings. And, from its 2021 high, the stock was down 62%.
This displeasure was made evident in June of 2023, when the company disclosed its proxy voting results. Shareholders had voted 20% against its directors (on average) and 35% elected ‘against’ on the company’s say-on-pay advisory vote.
So, Techtarget’s leadership chose to do something.
On January 10th, 2024, the company entered into a transaction with Informa PLC. As a consequence of this transformative merger, Techtarget bonds are set to receive 100 cents on the dollar - a 25% gain from the purchase price we had made in the prior year.

Source: Bloomberg
Source: Bloomberg
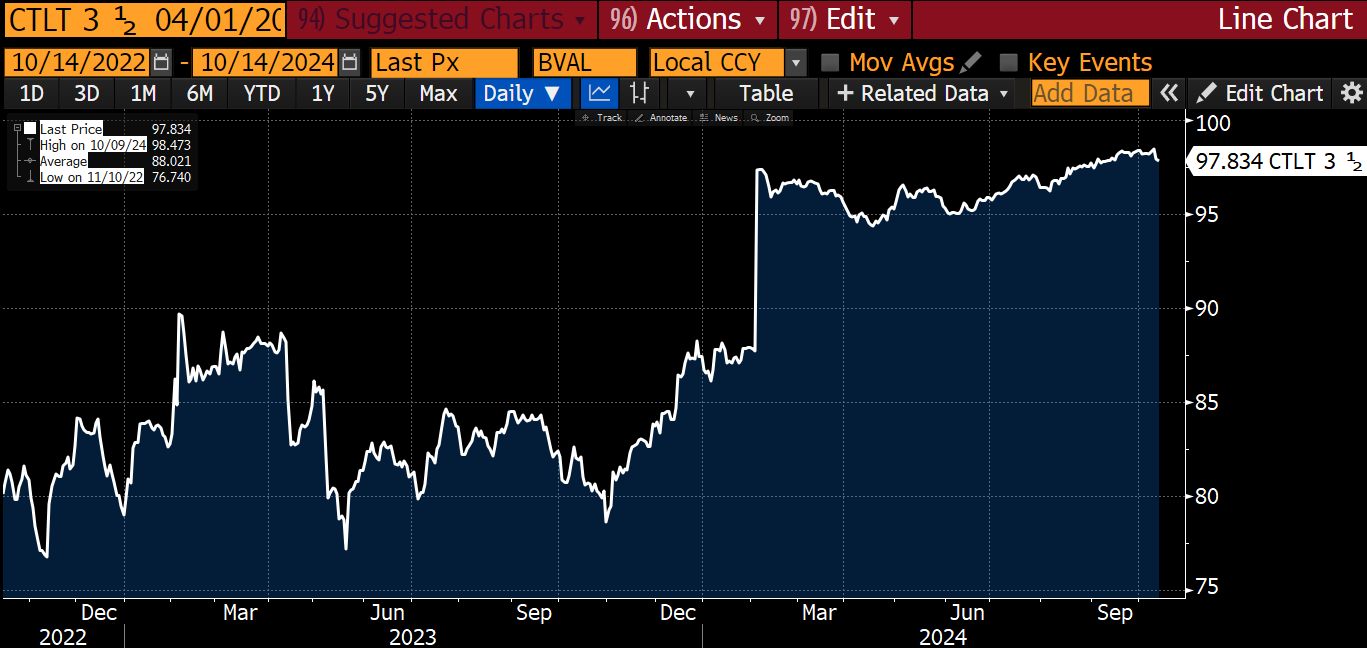
Catalent
We made our investment in Catalent’s Senior Unsecured bonds due in 2029 and 2030 at a price averaging less than 79 cents on the dollar in May of 2023. Catalent is a drug manufacturer carrying an enterprise value of more than $10B. The day we bought the company’s bonds, the stock was down 77% from its pandemic highs and was in the midst of operational mishaps, financial pressure and accounting delays. The pain was palpable as the embarrassment. The day prior to our first purchase marked the stock’s post-pandemic low of $31.86.
Given the board’s weak position, the company’s size, reasonable balance sheet and prior media speculation of interest from Danaher, it was no surprise to us that by August the company counted an activist - Elliott Management, in this case - as a new prominent shareholder. The two parties signed a co-operation agreement and four new directors were added to the board.
On February 5th, 2024, Catalent press released an agreement to be purchased by Novo Holdings for $63.50. The transaction appears to implicate our bonds’ covenants and the market expects the bonds to be redeemed above 100 cents on the dollar at close, representing a return of more than 27% from our purchase price.

Source: Bloomberg
Source: Bloomberg
Appendix
Your Portfolio Manager


Randy joined Ewing Morris in 2015 as Partner and founding Portfolio Manager of the Ewing Morris Flexible Fixed Income Fund LP.
Prior to his current role, Randy was a Portfolio Manager at Norrep Capital Management, a boutique Canadian mutual fund company. At Norrep, Randy managed the firm’s $300mm in fixed income assets, which consisted of investments in the high yield corporate bond and senior loan market. Before joining Norrep, Randy was a partner and high yield credit analyst at Marret Asset Management, one of Canada’s leading high yield credit specialists.
Randy received a Bachelor’s of Commerce degree in Finance from the Sauder School of Business at the University of British Columbia in 2007 and became a CFA Charterholder in 2011. Randy is also a Leslie Wong Fellow, having participated in UBC’s Portfolio Management Foundation during his time at Sauder.
The Data Behind the Outlier Ideas
Chemtrade Logistics Income Fund
Investment Outcome
|
Issue |
Weight |
Cost |
Exit |
HPR |
IRR |
|---|---|---|---|---|---|
|
5.25% Convertible Debs due 6/2021 |
9.2% |
93.15 |
100.00 |
8.8% |
31.8% |
|
5% Convertible Debs due 8/2023 |
7.3% |
72.09 |
100.00 |
48.5% |
31.4% |
|
4.75% Convertible Debs due 5/2024 |
16.4% |
66.43 |
99.72 |
59.9% |
36.0% |
|
6.5% Convertible Debs due 10/2026 |
1.9% |
71.16 |
89.47 |
27.8% |
124.6% |
|
8.5% Convertible Debs due 9/2025 |
0.3% |
86.99 |
108.00 |
27.8% |
81.5% |
Source: Bloomberg, Ewing Morris. Cost and exit prices are weighted averages. Weight based on market value as of the month end of last purchase date. HPR = Holding Period Return. IRR = Internal Rate of Return.
Prevailing Capital Structure

Source: Bloomberg, Ewing Morris
Source: Bloomberg, Ewing Morris
Credit Perspective
<4x levered credit with ~500mm in equity market value
High-value issuer supported by Canadian Banks
Immediately cut dividend by 50% in March
2021 debentures payable in shares if needed
Exceptionally low bankruptcy risk
Parkland
Investment Outcome
|
Issue |
Weight |
Cost |
Exit |
HPR |
IRR |
|---|---|---|---|---|---|
|
5.625% Senior Notes due 5/2025 |
19.6% |
99.63 |
103.33 |
8.2% |
10.5% |
|
6% Senior Notes due 6/2028 |
0.6% |
100.00 |
106.75 |
11.2% |
15.5% |
Source: Bloomberg, Ewing Morris. Cost and exit prices are weighted averages. Weight based on market value as of the month end of last purchase date. HPR = Holding Period Return. IRR = Internal Rate of Return.
Prevailing Capital Structure

Source: Bloomberg, Ewing Morris
Source: Bloomberg, Ewing Morris
Credit Perspective
Strong double-B credit with ~6Bn in equity market value
Reasonable COVID-impacted leverage of 4.5x
Debt paydown becomes (and remained) top capital priority
Ample free cash flow and modest dividend
Conservative management team
Robust underlying fuel distribution businesses
J2 Global
Investment Outcome
|
Issue |
Weight |
Cost |
Exit |
HPR |
IRR |
|---|---|---|---|---|---|
|
3.25% Sr. Convertible Notes due 6/2029 | Common Stock Hedge |
3.2% |
102.75 / 125.00 |
195.22 / 125.52 |
90.9% |
108.7% |
|
1.75% Sr. Convertible Notes due 11/2026 |
18.7% |
86.78 |
99.125 |
17.8% |
9.6% |
Source: Bloomberg, Ewing Morris. Cost and exit prices are weighted averages. Weight based on market value as of the month end of last purchase date. HPR = Holding Period Return. IRR = Internal Rate of Return.
Prevailing Capital Structure

Source: Bloomberg, Ewing Morris
Source: Bloomberg, Ewing Morris
Credit Perspective
Short seller concerns an opportunity for the credit
Gross leverage at only 3x
Highly liquid balance sheet - net leverage <2x
Levered FCF/Gross Debt 20-25%
Management team experienced in leveraged finance
Highly convex convertible - putable with equity upside
Shaw
Investment Outcome
|
Issue |
Weight |
Cost |
Exit |
HPR |
IRR |
|---|---|---|---|---|---|
|
Series A Preferred Share |
8.3% |
20.80 |
25.00 |
21.0% |
95.4% |
|
Series B Preferred Share |
13.0% |
18.56 |
25.00 |
35.1% |
184.4% |
Source: Bloomberg, Ewing Morris. Cost and exit prices are weighted averages. Weight based on market value as of the month end of last purchase date. HPR = Holding Period Return. IRR = Internal Rate of Return.
Prevailing Capital Structure

Source: Bloomberg, Ewing Morris
Source: Bloomberg, Ewing Morris
Credit Perspective
Forthcoming transformation in capital structure
Press release mentioned possible decision point on prefs
Merger agreement contemplated pre-closing changes to capitalization
Bad look if Rogers orphaned retail Shaw pref holders
Rogers had no preferreds since early 2000's
Redemption window (June 30) fell within the broader corporate transaction timeline
Consensus Cloud Solutions
Investment Outcome
|
Issue |
Weight |
Cost |
Exit |
HPR |
IRR |
|---|---|---|---|---|---|
|
6.0% Senior Notes due 10/2026 |
8.7% |
100.00 |
98.16 |
15.0% |
5.5% |
|
6.5% Senior Notes due 10/2028 |
15.8% |
100.00 |
96.53 |
15.1% |
5.5% |
Source: Bloomberg, Ewing Morris. Cost and exit prices are weighted averages. Weight based on market value as of the month end of last purchase date. HPR = Holding Period Return. IRR = Internal Rate of Return.
Prevailing Capital Structure

Source: Bloomberg, Ewing Morris
Source: Bloomberg, Ewing Morris
Credit Perspective
Exceptionally high FCF conversion
4x levered credit on a path to de-lever to 3x
Deleveraging plan relied solely on free cash flow
Conservative, well-understood CEO (former CFO of J2 Global)
Possible tailwind from open market purchases in year three once sufficient cash is built.
Ziff Davis
Investment Outcome
|
Issue |
Weight |
Cost |
Exit |
HPR |
IRR |
|---|---|---|---|---|---|
|
Common Shares |
21.5% |
84.40 |
82.01 |
-2.8% |
-3.0% |
Source: Bloomberg, Ewing Morris. Cost and exit prices are weighted averages. Weight based on market value as of the month end of last purchase date. HPR = Holding Period Return. IRR = Internal Rate of Return.
Prevailing Capital Structure

Source: Bloomberg, Ewing Morris
Source: Bloomberg, Ewing Morris
Investment Perspective
Equity valuation attractive - ~7x EBITDA | 10% FCF Yield
Firmly established, programmatic acquirer
Long-time record of deploying capital at 5x
Termed-out debt obligations + highly liquid balance sheet
Reckoning in VC/media set to be a boon for Ziff
Private equity takeout optionality
Bandwidth
Investment Outcome
|
Issue |
Weight |
Cost |
Price |
HPR |
IRR |
|---|---|---|---|---|---|
|
0.5% Senior Notes due 4/2028 |
35.7% |
62.34 |
80.22 |
29.0% |
20.2% |
Source: Bloomberg, Ewing Morris. Cost and exit prices are weighted averages. Weight based on market value as of the month end of last purchase date. HPR = Holding Period Return. IRR = Internal Rate of Return.
Prevailing Capital Structure

Source: Bloomberg, Ewing Morris
Source: Bloomberg, Ewing Morris
Credit Perspective
Highly valuable, strategic telecom services platform
Understated earnings power
Outstanding debt offset by substantial cash balance
Consistent revenue growth / expanding profitability
Front edge of substantial debt paydown program
Underappreciated takeout optionality
Position management


Source: Bloomberg, Ewing Morris
Source: Bloomberg, Ewing Morris
Legal
This communication does not constitute an offer to sell units of any Ewing Morris Fund, collectively, “Ewing Morris Funds”. Units of Ewing Morris Funds are only available to investors who meet investor suitability and sophistication requirements. The Ewing Morris Funds have flexible investment mandates. We have listed the iShares U.S. High Yield Bond Index ETF (CAD-Hedged) and iShares Canadian Corporate Bond Index ETF as benchmarks for the Strategy because they are low-cost, index tracking funds; representative of an individual’s opportunity cost in fixed income and are widely known and followed fixed income benchmarks. We have also listed the Russell 2000 Total Return index as an equity benchmark for comparative purposes. These benchmark indices are provided for information only. Comparisons to benchmarks and indices have limitations. Investing in fixed income securities is the primary strategy for the Fund, but the Fund does not invest in all, or necessarily any, of the securities that compose the indices or the market indices. As a result, no market indices are directly comparable to the results of the Fund. The Fund’s portfolio may contain, among other things, options, short positions and other securities, highly concentrated levels of securities and may employ leverage not found in these indices. Returns are unaudited. Where performance period is longer than 12 months, the return is annualized. While information prepared in this report is believed to be accurate, Ewing Morris & Co. Investment Partners Ltd. makes no warranty as to the completeness or accuracy nor can it accept responsibility for errors in the report. This report is not intended for public use or distribution. There can be no guarantee that any projection, forecast or opinion will be realized. All information provided is for informational purposes only and should not be construed as personal investment advice. Users of these materials are advised to conduct their own analysis prior to making any investment decision. Past performance does not guarantee future results. Benchmark source: Bloomberg.
Thank you for considering this opportunity.
